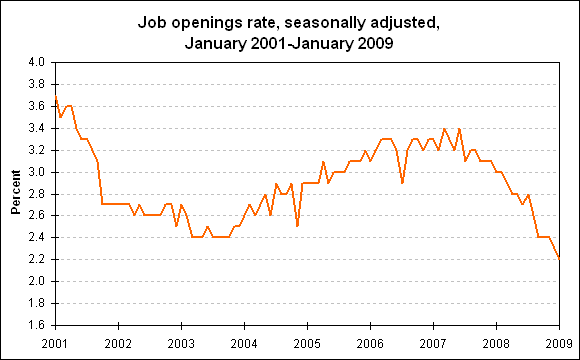
The job openings rate fell to a new series low of 2.2 percent (seasonally adjusted) in January 2009, continuing a 16-month downward trend. This is according to data released by the U.S. Department of Labor's Bureau of Labor Statistics.
At 3.0 million in January, monthly openings (seasonally adjusted) were down 1.6 million, or 35 percent, since the starting point of the downward trend in September 2007.
Over the 12 months ending in January, the job openings rate (not seasonally adjusted) was essentially unchanged in five industries: mining and logging; retail trade; information; educational services; and other services. In the remaining 12 industries, at the total nonfarm and total private level, and in all four regions, the job openings rate fell significantly over the year. The job openings rate rose significantly over the year only in the federal government.
This data is from the BLS Job Openings and Labor Turnover Survey. To learn more, see "Job Openings and Labor Turnover: January 2009," (PDF) (HTML) news release USDL 09-0245. Data for the most recent month is preliminary. Job openings include only those jobs open on the last business day of the month.


