Detect Soft Foot with Vibration Analysis
Tags: vibration analysis, condition monitoring, predictive maintenance

Soft foot poses a challenge for plant operations and maintenance personnel.
The common term for machine frame distortion, soft foot is caused when one or more feet of a machine are shorter, longer or angled some way different than the rest of the feet.
This non-uniformity causes stress on the machinery when the foot is forced into place by tightening the hold-down bolt. Missing shims under a foot, a bent foot, or a deteriorating base plate or foundation can cause this condition. In addition, pipe stress can cause machine frame distortion and, therefore, also is considered a soft foot condition.
When soft foot is present, the intended machine design and clearances are compromised. It can cause high vibration levels because the machinery is unduly exposed to excessive wear with each shaft revolution.
Deflection and Damage
Often, soft foot is not seen as a critical problem, but let’s investigate the damage it can cause. When machine frame distortion exists, the bearing housings are misaligned with respect to one another.
This offset, as well as angular misalignment, creates a load on the rotating shaft that results in shaft deflection. When the shaft turns, this results in vibration since the shaft must deflect by double the amount of the deflection at rest, at twice the speed of rotation.
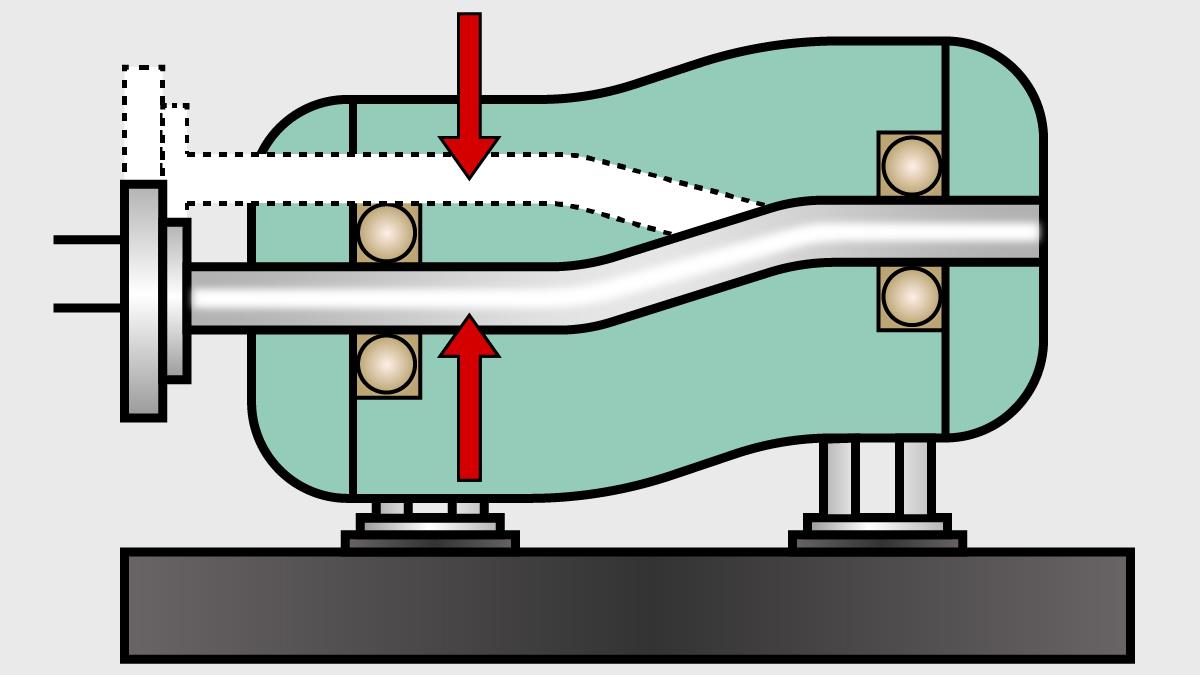
For example, at 1,800 revolutions per minute (RPM) running speed, a soft foot distortion provokes 5.184 million deflection cycles every 24 hours (Figure 1).

Figure 1. An example of preload on the bearings.
At 1,800 RPM, which equals 60 stress-reversal
cycles every second (reverses twice in each full
rotation), this is nearly 5.2 million back-and-forth
deflection cycles every 24 hours.
It is, of course, the bearings that directly transmit the forces required to do this to the shafts. Therefore, soft foot greatly increases the load on the bearings, results in increased power consumption and provokes metal fatigue of the shaft over time. Bearings and seals suffer premature wear and are prone to premature failure.
Vibration data can reveal signs of many machinery health problems, among them soft foot. How do you determine if soft foot is the culprit?
A machine is determined to have a soft foot if the calculated value of movement of a machine foot when tightened or loosened is at least 0.002 to 0.003 inches while the remaining feet are bolted tight. This condition often (but not always) causes an increase in overall machine vibration.
If the overall vibration level is too high, the next step is to determine why. A common practice is to take a spectrum on the bearing housing of the equipment. If safety is not compromised, take measurements while the machinery is operating.
Take a spectrum in live mode. This is a feature of some data collectors that allows the user to continuously view the spectrum while the machinery is running. This is handy if you are trying to view a transient event.
To help determine a soft foot issue, loosen each foot one at a time, always keeping the others tight, and then retighten while the spectrum is still measuring.
Any notable reduction in the one-times (1x) energy during the loosening process can be a strong indication of the relief of machine frame distortion. The graphs in Figure 3 display typical before and after conditions.

Figure 3a. Before the loosening sequence:
All four feet are tightened; the 1X amplitude
is 0.127 inches/second. Radial measurements
were taken in the vertical direction.

Figure 3b. After the loosening sequence:
One of the four feet was loose; the 1X
amplitude is now 0.048 inches/second.
This is a great indication of which foot has the greatest impact on relief of soft foot distortion, but you will need to further investigate with a good laser alignment tool, dial indicator or feeler gauges to properly measure and correct the problem.
Often, the soft foot signature or pattern is hard to detect. Commonly, soft foot appears at 1x the running speed of the equipment, both axially and radially, but is occasionally present at two and three times RPM.
Since soft foot can also affect alignment, misalignment characteristics may appear. The best indication of soft foot is an elevated 1x RPM vibration value. This is typically in the neighborhood of 0.3 inches/second or higher.
Very often, there is a significant 2x alternate current line frequency peak. The presence of this peak helps differentiate soft foot from imbalance and misalignment.
Using Phase Analysis
The signature of soft foot sometimes appears similar to looseness because the foot may, in fact, be loose. Foot looseness may emerge due to weakness in the base plate or foundation, deterioration of the grouting, loose hold-down bolts, or a cracked or broken foot. All of these situations are part of machine frame distortion. Phase analysis will help reveal this.
Phase analysis documents the relative motion between two different points. You can use it to determine continuity between two adjacent pieces of machinery (i.e., machine frame and supporting foundation). Phase analysis may show a 90- to 180-degree phase difference between vertical measurements on the bolt, machine foot, base plate or base (Figure 2).

Figure 2. Phase relationship can show differences
between vertical measurements on the bolt,
machine foot, base plate or base.
A quick way to acquire this data is with a data collector that offers cross-channel phase measurements. This allows the user to take vibration readings with an accelerometer and ascertain the phase information without the use of a tachometer.
This saves a considerable amount of time due to the skipped setup time that is necessary when a tachometer is used to collect phase data.
Irene Hamernick is an applications and sales engineer for Ludeca Inc. For more information on vibration analysis and soft foot conditions, contact her at 305-591-8935 or irene@ludeca.com. Also, visit the Ludeca Web site at www.ludeca.com.