The Producer Price Index for Finished Goods rose 0.1 percent in October, seasonally adjusted, according to the U.S. Department of Labor's Bureau of Labor Statistics. This increase followed a 1.1 percent advance in September and a 1.4 percent decline in August.
The index for finished consumer foods rose 1.0 percent in October after climbing 1.5 percent in September. Higher prices for fresh and dry vegetables, soft drinks, fresh fruits and melons, processed fruits and vegetables, and bakery products outweighed lower prices for beef and veal, pork, eggs for fresh use, dairy products, and processed young chickens.
The index for finished energy goods declined 0.8 percent in October, following a 4.1 percent advance in September. Gasoline prices decreased 3.1 percent after rising 8.4 percent a month earlier.
The index for finished goods other than foods and energy was unchanged in October after rising 0.1 percent in September.
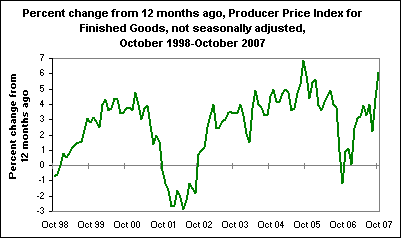
From October 2006 to October 2007, prices for finished goods rose 6.1 percent, as shown in the chart.
This data is from the BLS Producer Price Index program. To learn more, see "Producer Price Indexes — October 2007," news release USDL 07-1786. All producer price indexes are routinely subject to revision once, 4 months after original publication, to reflect the availability of late reports and corrections by respondents.


