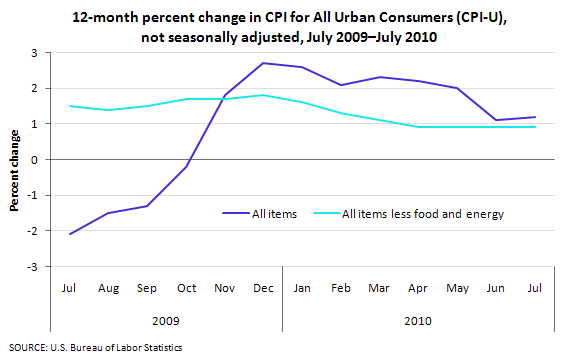
Over the last 12 months, the Consumer Price Index for All Urban Consumers (CPI-U) increased 1.2 percent before seasonal adjustment. The 12-month change in the index for all items less food and energy remained at 0.9 percent for the fourth month in a row.
The food index now has risen 0.9 percent over the last 12 months, with the food at home index up 0.7 percent. The indexes for fruits and vegetables, cereals and bakery products, and nonalcoholic beverages have declined over the past 12 months.
The energy index has increased 5.2 percent over the last 12 months. The gasoline index has risen 7.4 percent over the last 12 months, with the index for household energy up 2.5 percent.
Over the last 12 months, the index for all items less food and energy has risen 0.9 percent. Indexes that have increased over that time period include used cars and trucks (17.0 percent), medical care (3.2 percent), airline fares (10.2 percent) and tobacco (7.4 percent). In contrast, the shelter index has fallen 0.7 percent, the index for household furnishings and operations has declined 3.1 percent, and the indexes for recreation and for apparel have declined 0.8 percent and 0.3 percent, respectively.
This data is from the Consumer Price Index program. To learn more, see "Consumer Price Index — July 2010" (HTML) (PDF), news release USDL-10-1105.


