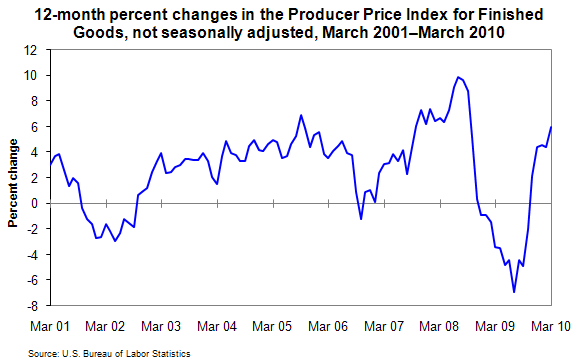
On an unadjusted basis, prices for finished goods advanced 6.0 percent for the 12 months ending in March 2010, the largest over-the-year gain since an 8.8-percent rise in September 2008. This is according to data released by the U.S. Department of Labor's Bureau of Labor Statistics.
The Producer Price Index for Finished Goods rose 0.7 percent from February to March, seasonally adjusted, following a 0.6-percent decline in February and a 1.4-percent increase in January.
In March, more than 70 percent of the increase in the finished goods index can be attributed to a 2.4-percent jump in prices for consumer foods. Also contributing to higher finished goods prices, the index for finished energy goods advanced 0.7 percent and prices for finished goods other than foods and energy edged up 0.1 percent.
This data is from the BLS Producer Price Index program. To learn more, see "Producer Price Indexes — March 2010" (HTML) (PDF), news release USDL-10-0491. All producer price indexes are routinely subject to revision once, four months after original publication, to reflect the availability of late reports and corrections by respondents.


