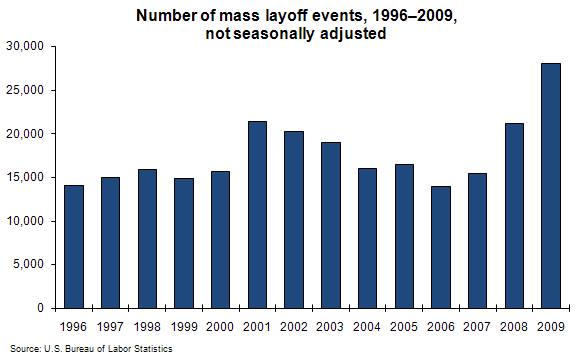
In 2009, the total number of mass layoff events, at 28,030, reached its highest annual level since 1996, the first year for which these data are available. This is according to new data released by the U.S. Department of Labor's Bureau of Labor Statistics.
The total number of initial claims for unemployment insurance benefits due to mass layoffs, at 2,796,456, was also the highest level on record.
Among the 19 major industry sectors in the private economy, manufacturing had the most initial claims in 2009 (1,137,106), followed by administrative and waste services (294,709) and construction (205,765). Manufacturing also had the largest over-the-year increase in total annual initial claims (266,796), with retail trade (57,283) and administrative and waste services (48,039) experiencing the next largest increases.
Among the major industry sectors, 12 registered series highs for both mass layoff events and initial claims in 2009: mining; construction; wholesale trade; retail trade; transportation and warehousing; finance and insurance; real estate and rental and leasing; management of companies and enterprises; administrative and waste services; health care and social assistance; arts, entertainment, and recreation; and accommodation and food services.
This data is from the Mass Layoff Statistics program. Annual data is not seasonally adjusted. Each mass layoff event involves at least 50 persons from a single employer. To learn more, see "Mass Layoffs—December 2009; Annual Totals—2009" (PDF) (HTML), news release USDL-10-0098.


