The Producer Price Index for Finished Goods decreased 1.2 percent in March, seasonally adjusted. This decline followed a 0.1-percent advance in February and a 0.8-percent increase in January.
Among finished goods, the index for energy goods turned down 5.5 percent in March after rising 1.3 percent in the preceding month. Prices for finished consumer goods less foods and energy inched up 0.1 percent following a 0.4-percent advance in February.
The capital equipment index fell 0.2 percent in March after moving up 0.1 percent in the prior month. By contrast, partially offsetting the downturn in finished goods prices, the decline in the index for finished consumer foods slowed to 0.7 percent in March from 1.6 percent in the previous month.
Excluding foods and energy, finished goods prices were unchanged in March following a 0.2-percent rise in February.
During the first quarter of 2009, the finished goods index declined at a 0.9-percent seasonally adjusted annual rate (SAAR), after falling at a 24.9-percent SAAR during the fourth quarter of 2008. This slower rate of decrease can be traced to prices for finished energy goods, which moved down at a 2.7-percent SAAR for the 3 months ended in March after dropping at a 76.7-percent SAAR for the 3 months ended in December.
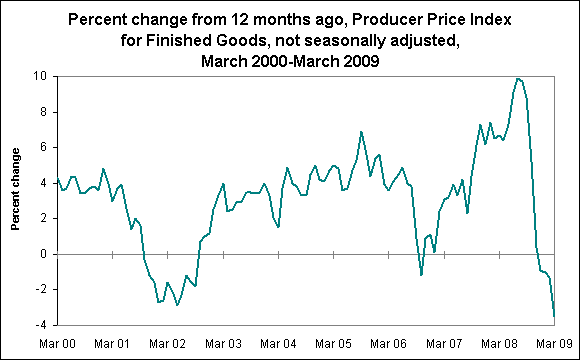
From March 2008 to March 2009, prices for finished goods fell 3.5 percent, as shown in the chart.
This data is from the BLS Producer Price Index program. To learn more, see "Producer Price Indexes — March 2009," (PDF) (HTML) news release USDL 09-0387. All producer price indexes are routinely subject to revision once, four months after original publication, to reflect the availability of late reports and corrections by respondents.


