


In January 2010, the median number of years that wage and salary workers had been with their current employer was 4.4, the U.S. Department of Labor's Bureau of Labor Statistics reported.
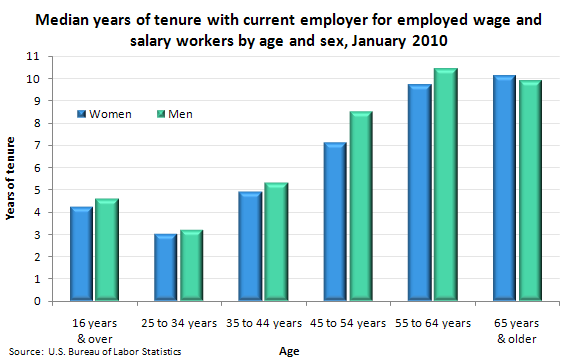
In January 2010, median tenure for men was 4.6 years, up from 4.2 years in January 2008. For women, median tenure in January 2010 was 4.2 years, slightly higher than the median (3.9 years) in January 2008.
Also, among men, 30 percent had at least 10 years of tenure with their current employer, compared with 28 percent among women.
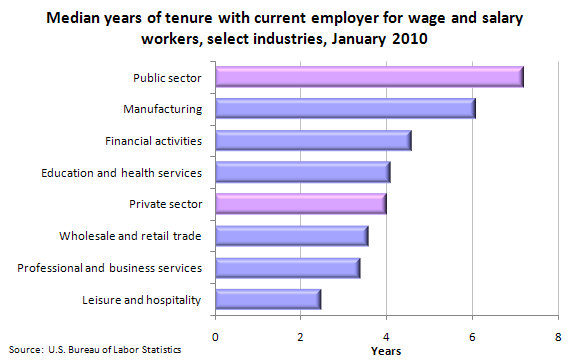
In January 2010, wage and salary workers in the public sector had nearly double the tenure of their counterparts in the private sector, 7.2 and 4.0 years, respectively.
The longer tenure among workers in the public sector is explained, in part, by the age profile of government workers. Seventy-four percent of government workers were ages 35 and over, compared with 62 percent of private wage and salary workers.
In January, within the private sector, workers in manufacturing had the highest median tenure among the major industries (6.1 years). In contrast, workers in leisure and hospitality had the lowest median tenure (2.5 years). On average, workers in manufacturing tend to be older than those in leisure and hospitality.
This data comes from the BLS Current Population Survey (CPS) program. Information on employee tenure has been obtained from supplemental questions to the CPS every two years since 1996. To learn more, see "Employee Tenure — January 2010" (HTML) (PDF), news release USDL-10-1278.
