×


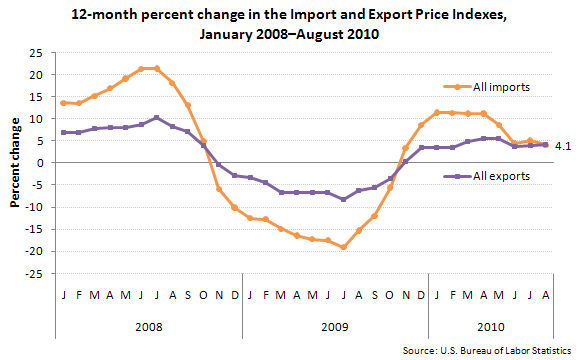
Chart: Import and export prices by month since January 2008
The price index for overall imports rose 4.1 percent for the year ended in August, the smallest 12-month advance since a 3.4 percent rise for the November 2008-2009 period. The price index for overall exports also increased 4.1 percent over the past 12 months.
Prices for fuel imports rose 9.1 percent over the past 12 months; an 8.5-percent increase in petroleum prices and a 25.0-percent jump in natural gas prices each contributed to the overall advance. Nonfuel import prices advanced 2.9 percent over the past year.
Agricultural exports prices advanced 6.4 percent over the past year. Nonagricultural prices increased 3.9 percent for the year ended in August.
This data is from the BLS International Price program. See "U.S. Import and Export Price Indexes — August 2010" (HTML) (PDF), news release USDL-10-1279, to learn more. Import and export price data is subject to revision.
