


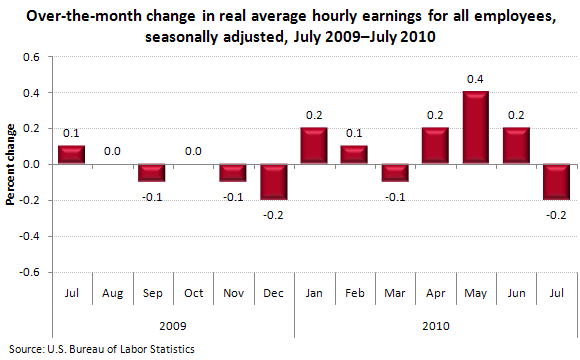
Real average hourly earnings for all employees fell 0.2 percent from June to July, seasonally adjusted. This decrease stems from a 0.2-percent increase in average hourly earnings combined with a 0.3-percent increase in the Consumer Price Index for All Urban Consumers (CPI-U).
Real average weekly earnings rose 0.2 percent over the month, as a result of a 0.3-percent increase in the average work week combined with the decrease in real average hourly earnings. Since reaching a recent low point in October 2009, real average weekly earnings have risen 2.0 percent.
Over the year (July 2009 to July 2010), real average hourly earnings rose 0.4 percent, seasonally adjusted. An increase in average weekly hours of 1.2 percent combined with the increase in real average hourly earnings resulted in a 1.6-percent increase in real average weekly earnings during this period.
This earnings data is from the Current Employment Statistics program. Earnings data for June and May is preliminary and subject to revision. To learn more, see "Real Earnings — July 2010" (HTML) (PDF), news release USDL-10-1106.
