×


Chart: Employee union representation elections, 1997-2009
The total number of union representation elections declined by 60 percent over the 1997-2009 period, from 3,261 to 1,304; over the same period, the number of elections won in favor of union representation declined by 48 percent, from 1,656 to 864.
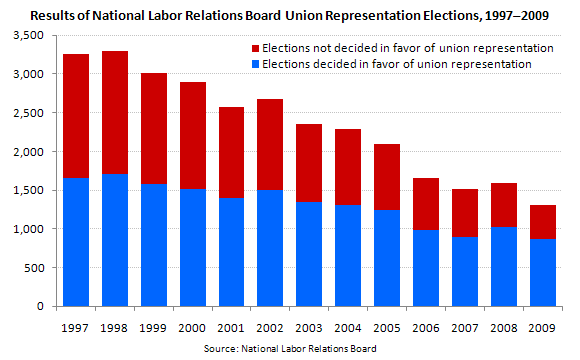
Because the number of elections won in favor of union representation declined at a slower rate than the total number of elections, the percent of elections won in favor of union representation increased, from 51 percent in 1997 to 66 percent in 2009.
The number of employees eligible to vote in elections decreased by 69 percent over the period, from 224,262 in 1997 to 69,832 in 2009. Although the number of employees eligible to vote in elections won by unions has fluctuated from year to year, overall it declined by 51 percent.
Despite the decrease, the data shows that, if an employee was involved in a union representation election, the employee was more likely to gain union representation in 2009 than in 1997. In addition, there is a greater tendency for employees to choose union representation when two or more unions are seeking certification than when only one union is seeking certification.
To learn more, see National Labor Relations Board (NLRB) Union Representation Elections, 1997-2009, in the June 2010 Compensation and Working Conditions Online. This data is from the National Labor Relations Board, one of whose functions is to determine, through secret-ballot elections, whether employees wish to be represented by a union in dealing with their employers, and if so, by which union.
