Do you want to increase profits and reduce maintenance costs for your facility?
It is common knowledge that technologies such as vibration analysis, shaft alignment, oil analysis, thermal imaging, motor circuit testing and several other technologies are excellent tools to help achieve these results. These technologies can be used for the identification and elimination of machinery defects on a daily basis.
Many facilities are content with the knowledge that machinery defects (bearing defects, gearbox defects, etc.) have been identified, scheduled for maintenance and ultimately repaired utilizing these technologies. An optimized reliability program will constantly seek the root causes that create the machinery defects, thereby avoiding many chronic and recurring problems. Most facilities believe that finding the root cause of equipment defects can be difficult.
This may be true in some cases, but it is not always the reality. In fact, many of the actual root causes of equipment defects can be easily identified. The elimination of these root causes will reduce the amount of equipment defects that must be repaired over time, help you achieve the goal of reduced maintenance cost and increase profits at your company.
Vibration analysis is a method of finding what forcing function is causing unwanted harmful vibrations and the resulting defects in equipment. However, these defects can be very difficult to distinguish from one another when using only vibration data for identification. If the defect is not accurately identified, then incorrect or unnecessary maintenance may be completed on the equipment as a result. If the root causes are not identified, then the same repair will be repeated over time. All of this increases the overall cost of maintenance and reduces company profit.
Looseness-related conditions are some of the most common issues found in equipment and can be some of the easiest to correct. These conditions, if uncorrected, can create costly routine equipment defects and haunt maintenance staff. This results in continual equipment maintenance and higher repair cost.
Mechanical looseness can be placed into one of two categories:
- Structural
- Rotating element (component looseness)
Structural looseness may act as a vibration amplifier. The stiffness of the equipment or structure changes as the looseness develops and increases in severity. This can allow the resonance frequency to change and overlap with another defect frequency in the machine. This will increase the defect amplitudes and cause the equipment to fail more quickly. Damage due to this effect can be very costly and is completely avoidable.
Structural looseness can be created by base mounting issues, bearing caps, casings, supports, improper/broken welds, etc. These types of conditions are difficult to identify and determine the root cause when using only vibration patterns.
Phase data can often be used to determine the exact problem in the equipment when the vibration data does not provide a clear indication. Phase analysis is one of the most overlooked capabilities that can be used to identify and locate unwanted equipment defects such as structural looseness. Therefore, phase analysis is a very valuable diagnostic tool available to the analyst and can be easily used to identify the root cause of many equipment problems.
It is critical that the analyst have a clear understanding of phase relationships before attempting any type of phase measurements. Phase is the relationship between two events in time. These events may occur in sync (in phase) or out of sync (out of phase) with each other.
This distinction is very important and can easily be used to identify structural looseness issues. Phase readings collected on two measurement locations in close proximity to one another should have comparable values. Dissimilar phase values are an indication that the locations are vibrating out of sync (out of phase) with each other and looseness may be present.
Moving the vibration sensor from one radial direction to another (vertical to horizontal) should result in approximately a 90-degree phase shift. Moving the sensor within the same radial direction (horizontal to horizontal or vertical to vertical) should result in approximately the same phase values. It is not uncommon to see a phase shift of approximately plus-or-minus 30 degrees when moving the vibration sensor from one measurement location to another, and this is acceptable.
Figure 1 shows equipment that has been checked for structural looseness. Notice that the measured phase readings remain very similar as the vibration sensor is moved within the same measurement plane. This indicates that no structural looseness issues are present on this side of the machine.
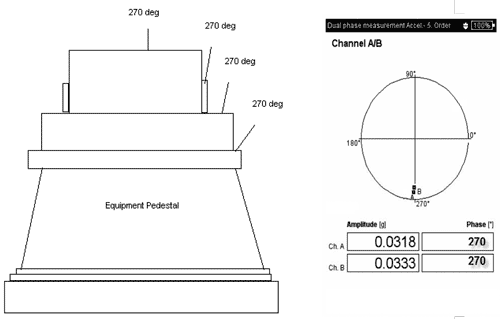
Figure 1. Equipment with no Structural Looseness
Phase should be measured across all bolted or welded joints. Phase readings will suddenly become erratic, from point to point, once a loose component/location is found. Often, the phase shift will change between 90 and 180 degrees from the previous measurement location.
Figure 2 shows a second machine that has been checked for structural looseness. Notice that the phase readings are very similar until a specific measurement location is reached. The phase readings suddenly change. X marks the spot, and the sudden change in phase values indicates a structural looseness issue at the specific measurement location.
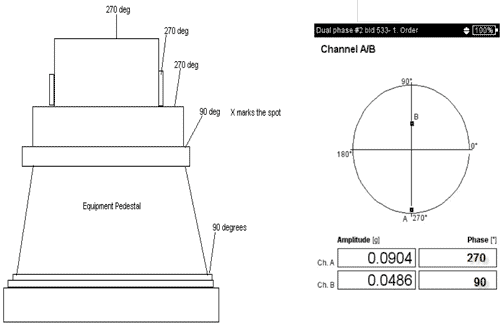
Figure 2. Equipment with Structural Looseness
Phase measurements can be used to identify loose mounting foot conditions in equipment as well (see Figure 3). A loose foot will show a phase shift from the foot to the foundation. Also, a phase difference from the suspect foot compared to the other machine feet should be observed. The phase shift is usually greater than 90 degrees.
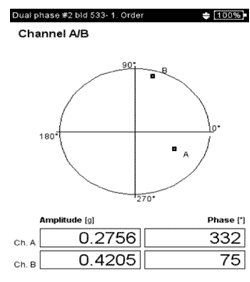
Figure 3.
Another option now available to the analyst is the ability to collect relative phase measurements routinely in a route. This data can be trended over time along with other route-based measurement data (Figure 4). The trend data will show an indication as the equipment condition changes over time.
This can be done without a tachometer signal by using a cross-channel phase measurement in the route. In fact, collecting route-based relative phase measurements is an excellent option for machines that have experienced expensive repairs or caused collateral damage due to looseness-related issues. This type of routine information may allow such expensive failures to be avoided and the integrity of the structure or equipment to be maintained.
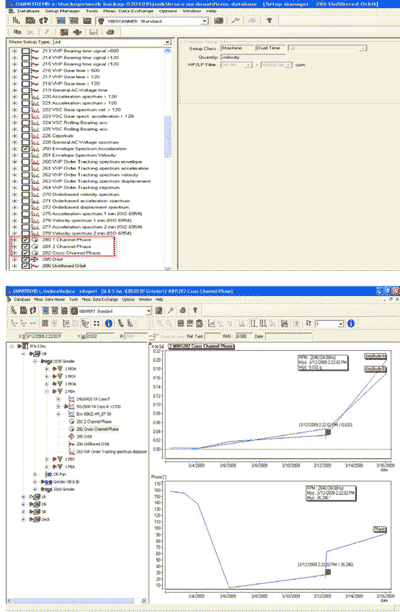
Figure 4.
Proper preparation is imperative prior to conducting any phase measurements. The measurement locations should be clean of dirt, etc. A simple drawing should be created for identifying the desired measurement locations and recording the measured results. This drawing may be simple, but it will prove critical when analyzing the results. Figure 5 shows a simple outline that can be routinely used for phase measurements.

Figure 5. Sample Phase Outline
Basic phase data is not difficult to acquire and can provide a wealth of information. This information will help identify many of the root cause conditions that create equipment defects at your facility. These conditions can be eliminated and, as a result, reduce the amount of routine equipment failures experienced (bearing defects, etc.). This results in overall savings in maintenance costs and increased profits.
If you are expected to reduce maintenance costs and increase profits, do not overlook the technologies you may have available or may purchase. Do not assume that all of the functionality these technologies offer is complicated to use. Not providing these technologies to your maintenance staff or underutilizing the technologies you already have available will actually lead to increased maintenance costs and reduced profits.
About the author:
Trent Phillips is the condition monitoring manager for Ludeca Inc., a vendor of shaft alignment, vibration analysis and balancing equipment. He can be reached at 305-591-8935 or Trent.Phillips@ludeca.com. For additional information, visit www.ludeca.com.


