Chart: State employment changes over the past year
Tags: talent management, business management
From October 2009 to October 2010, non-farm payroll employment increased in 36 states and the District of Columbia and decreased in 14 states.
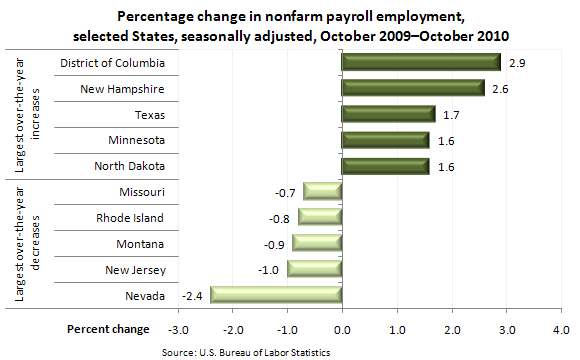
The largest over-the-year percentage increase in employment was reported in the District of Columbia (+2.9 percent), followed by New Hampshire (+2.6 percent), Texas (+1.7 percent), and Minnesota and North Dakota (+1.6 percent each).
The largest over-the-year percentage decrease in employment occurred in Nevada (−2.4 percent), followed by New Jersey (−1.0 percent), Montana (0.9 percent), Rhode Island (−0.8 percent), and Missouri (−0.7 percent).
Between September and October, the largest over-the-month percentage increases in employment were in Arkansas (+1.5 percent), New Mexico (+0.8 percent), and Maine and North Dakota (+0.7 percent each); the largest over-the-month percentage decreases in employment occurred in Delaware (−0.7 percent), Nevada (−0.2 percent), and Missouri and Virginia (−0.1 percent).
This data is from the Current Employment Statistics (State and Metro Area) program and is seasonally adjusted. To learn more, see "Regional and State Employment and Unemployment — October 2010" (HTML) (PDF), news release USDL-10-1628.